Environmental Management
Global Environmental Policy
Purpose
The TOTO Group considers conservation of the global environment to be one of the most important issues in need of addressing and contributes to the creation of a sustainable society by promoting highly environmentally conscious corporate management.
Text
- The TOTO Group develops water-saving, air-cleaning and other environmentally friendly products and services and contributes to reducing the loads on the global environment.
- The TOTO Group reduces environmental loads in every process of its business activities.
- The TOTO Group builds an environmental management system for making continuous improvement.
- The TOTO Group strives for conservation and sustainable utilization of biodiversity.
- Through active communication, the TOTO Group aims to achieve a better global environment.
Global Environmental Action Plan
12th Global Environmental Action Plan(Targets)
The Global Environmental Action Plan is an action plan established in response to the environmental issues identified under WILL2030.
| Evaluation Index (KPI) | Scope | Base Year | FY2024 (Results) | FY2026 (Targets) |
| Avoided Emissions of water during product use * | Japan・overseas | - | 9.3 billion m3 | 11.4 billion m3 |
| Avoided Emissions during product use * | Japan・overseas | - | 2.81 million tons | 3.60 million tons |
| CO2 emissions from business sites (Scope1 and 2) | Japan・overseas | - | 246 thousand tons | 229 thousand tons |
| CO2 emissions per unit of sales | Japan・overseas | - | 0.340 tons / million yen | 0.269 tons / million yen |
| Renewable energy introduction rate | Japan・overseas | - | 36.6% | 60% |
| Total amount of water withdrawals | Japan・overseas | - | 1.78 million m3 | 2.38 million m3 |
| Reta of improvement for total amount of water withdrawals | Japan・overseas | - | 29% | 15% |
| Reduction of fuel used for transportation per unit | Japan | FY2021 | 15.3% | 15.3% or more |
| Reduction rate of the use of packaging materials | Japan | FY2021 | 18.9% | 2.6% or more |
Reduction rate of waste at the production sites (reduction of production output intensity) | Japan | FY2023 | 8.3% | 1.5% |
| Recycling rate at the production sites | Japan | - | 99.1% | 99% or more |
| Overseas | - | 98.9% | 99% or more | |
| Usage rate of legal and recycled materials for wood-based materials used in products | Japan | - | 100% | 100% |
| Overseas | - | 100% | ||
| Total | - | 100% | ||
| Violations of related environmental laws | Japan | - | 0 cases | 0 cases |
| Overseas | - | 0 cases | ||
| Total | - | 0 cases |
* Reduction effects compared to if 2005-era products continued to be distributed.
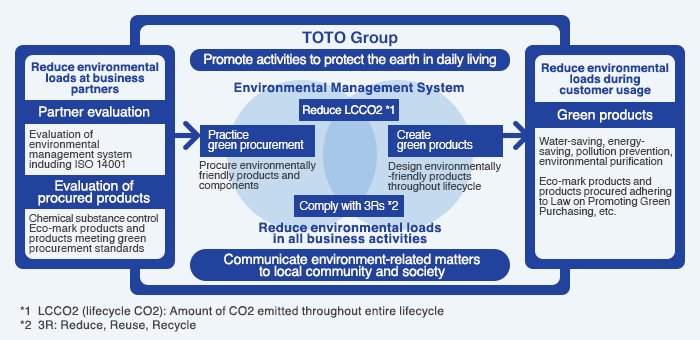
Environmental Management System
The TOTO Group has been established an environmental management system to achieve the environmental goals of the entire group.
The TOTO Group has established the following management system to promote environmental conservation activities.
Top management conducts a company-wide environmental management review twice a year to discuss the progress of the Global Environmental Action Plan and important matters related to the continuous improvement of the management system.
For specialized matters, we have established subcommittees and Legal Control Divisions, which have been assigned the role of leading the entire TOTO Group, including domestic and overseas group companies, in terms of goals and measures.
Promoting an Environmental Management System
The TOTO Group has introduced ISO14001 to continuously improve activities and mechanisms for addressing environmental issues.
ISO14001 certification has been obtained by subcommittees and Legal Control Divisions that oversee the environmental conservation activities of the entire group, as well as the manufacturing divisions (including domestic and overseas group companies) and factory management divisions, which have a large environmental load and impact. In addition, the sales divisions (including domestic and overseas group companies), which have a relatively small environmental burden and impact, are promoting environmental activities under the supervision of subcommittees and Legal Control Divisions.
Acquisition of ISO 14001 certification in Japan
Acquisition of ISO14001 certification in Japanese manufacturing plants
Name of the company *The following company obtained domestic unified certification in March 2014. |
| TOTO LTD. |
| TOTO SANITECHNO LTD. |
| TOTO WASHLET TECHNO LTD. |
| TOTO AQUATECHNO LTD. |
| TOTO Bath Create LTD. |
| TOTO High Living LTD. |
| TOTO PLATECHNO LTD. |
| TOTO MATERIA LTD. |
| TOTO OKITSUMO Coatings LTD. |
| TOTO Fine Ceramics LTD. |
| SUNAQUA TOTO LTD. |
| TOTO Maintenance LTD. |
| TOTO AQUAENG LTD. |
Acquisition of ISO 14001 certification overseas
Acquisition of ISO14001 certification in overseas manufacturing plants
| Name of the company | Acquisition status |
| TOTO MALAYSIA SDN.BHD. | Certification acquired at September, 2000 |
| TAIWAN TOTO CO., LTD. | Certification acquired at November, 2004 |
| TOTO (SHANGHAI) CO., LTD. | Certification acquired at February, 2005 |
| NANJING TOTO CO., LTD. | Certification acquired at June, 2005 |
| TOTO DALIAN CO.,LTD. | Certification acquired at February, 2006 |
| TOTO (GUANGZHOU) CO.,LTD. | Certification acquired at October, 2006 |
| TOTO USA., INC Morrow Plant | Certification acquired at February, 2007 |
| TOTO VIETNAM CO.,LTD. Dong Anh Plant | Certification acquired at January, 2008 |
| TOTO VIETNAM CO.,LTD. Hung Yen Plant | Certification acquired at January, 2008 |
| TOTO INDIA INDUSTRIES PVT. LTD. Gujarat Plant | Certification acquired at September 2015 |
| TOTO USA., INC Lakewood Plant | Certification acquired at February 2016 |
| TOTO USA.,INC Fairburn Plant | Certification acquired at February 2016 |
| TOTO USA., INC Ontario Plant | Certification acquired at February 2016 |
| TOTO MEXICO, S.A.DE. C.V. | Certification acquired at December 2016 |
| TOTO (Thailand) CO.,LTD. Plant 1 | Certification acquired at May 2018 |
| TOTO (FUJIAN) CO., LTD | Certification acquired at September 2018 |
| TOTO (Thailand) CO.,LTD. Plant 2 | Certification acquired at May 2019 |
| TOTO (Thailand) CO.,LTD. Plant 3 | Certification acquired at September 2020 |
| TOTO VIETNAM CO.,LTD. Vinh Phuc Plant | Certification acquired at October, 2024 |
TOTO Group’s Initiative to Foster Environmental Awareness
The TOTO Group provides all its members with an annual opportunity to learn together about its environmental impact. After the learning, discussions are held in each workplace, with the aim of participants taking the content personally, deepening their understanding and putting it into practice.
Related Information
お気に入りに保存しました